Data
Capital News Service
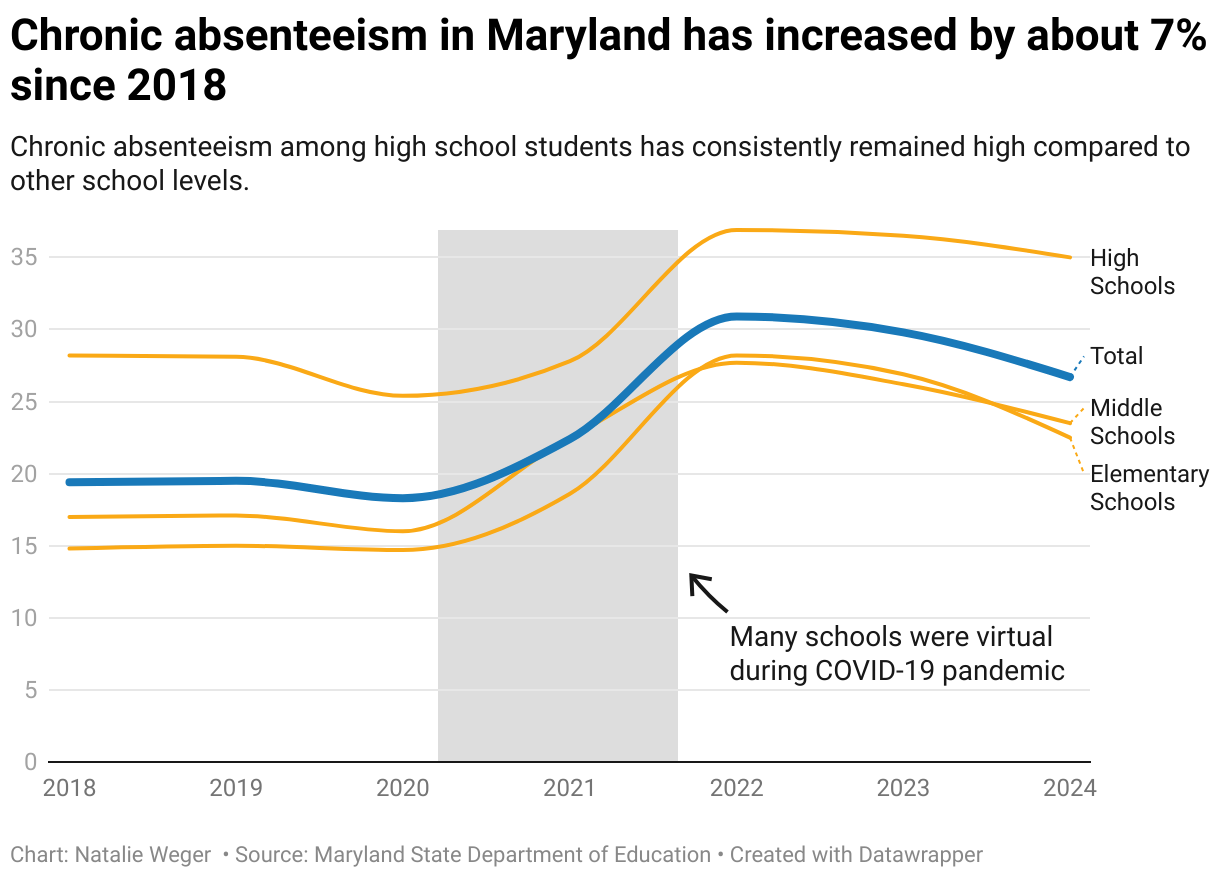
Thousands of Maryland students are chronically absent each year. Here’s what we know
February 27, 2025
After Maryland saw a surge in chronic absenteeism rates across the state, I spoke with a principal, student, teacher and state delegate about how the rise impacts education. I used R to analyze and combine several spreadsheets of student absenteeism data from the Maryland State Department of Education. Then, I used Adobe Illustrator and DataWrapper to visualize my analysis.

Maryland faced coldest winter in six years
April 1, 2025
I experimented DataWrapper and Flourish to make fun graphics about Maryland snowfall over the years. My story heavily relied on the snowfall data, which I had scraped from the National Oceanic and Atmospheric Administration.


The Daily Record
Moore administration launches $20M initiative to address child poverty: ‘Every day we fail to address this’
July 11, 2024
After the Moore administration highlighted child poverty as a top of mind issue, I created a line chart that shows the child poverty rate in Maryland over the last decade. Using Excel, I also calculated the rate of child poverty across Maryland counties using data from more than 1,400 Census tracts. These calculations then went into a projection map of the child poverty rate in Maryland.
The Local News Network
Maryland’s education ‘Blueprint’ struggles to expand pre-K
Co-Written with Marijke Friedman | March 7, 2024
For this projection map, I used data from the Maryland State Department of Education to display the participation rates in prekindergarten by county. Marijke and I interviewed about a dozen early childhood education experts in how the Blueprint for Maryland's Future will affect prekindergarten. The article is part of a larger series in the Local News Network and was picked up by various news outlets, including The Baltimore Sun, The Capital Gazette, The Daily Record and MoCo360 Media.
The Diamondback
UMD sees about 26% increase in Black faculty from 2021 to 2023
April 11, 2024
I broke this story on faculty diversity after doing a spreadsheet analysis of race data from the university's institutional research, planning and assesment office. My analysis uncovered this surprising statistic from data that has always been publicly available to students. The article delves into faculty diversity at the University of Maryland and how Black faculty feel about this recent increase.
Prince George's County Council discusses restricting locations of cannabis dispensaries
October 9, 2023
For the map visualization, I cleaned a dataset of more than 70 names and addresses of cannabis dispensaries in Maryland with Excel. After that, I used Flourish to create an interactive projection map that shows the location of the dispensaries in Maryland. The column chart to compares the monetary adult-use and medical-use sales of cannabis over three years in Maryland. My reporting includes interviews with county council members and a cannabis dispensary owner about how zoning ordinaces will affect Prince George's County.
Yahentamitsi Dining Hall sees most hand swipes since 2017
April 11, 2023
To find the most popular dining hall at my university, I made a FOIA request for the number of hand waves in the dining halls between 2017 to 2022. I analyzed that data in Excel and then used Flourish to create an interactive line chart that displayed the trends in four dining halls over five years. I also created an interactive column chart with Flourish to show the popularity of dining halls during the Fall 2022 semester.
3 years after joining program to diversify faculty, UMD sees mixed progress
February 16, 2024
My analysis into the diversity of STEM faculty at my university started when I extracted data from the university's institutional research, planning and assessment office. I refined the three-year dataset into a Google Sheet and then visualized the racial and gender makeup of STEM faculty in 2023 with Flourish.